editor’s note: i decided to capture a few live reads and see how they change the graph. according to WSO/Steve Olson, this does not normally occur…
******
Your Official Go-To Blog on Ascension, New Earth, Spirituality, UFO's, Real History, New Technologies and All Things Alternative

editor’s note: i decided to capture a few live reads and see how they change the graph. according to WSO/Steve Olson, this does not normally occur…
******
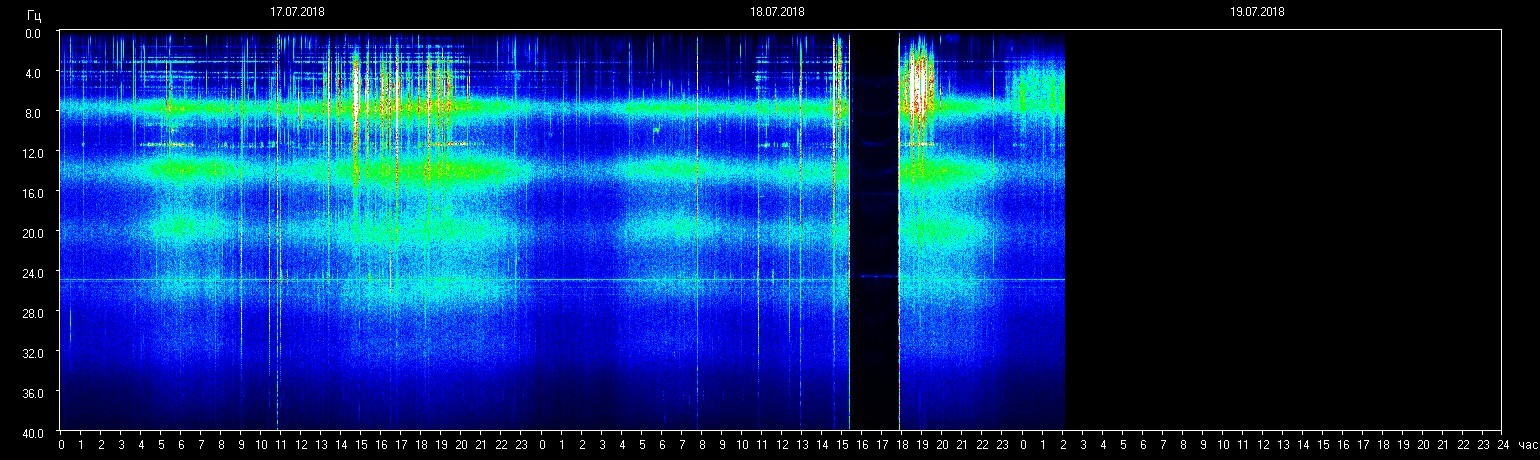
editor’s note: what is THAT?? it doesn’t look like a simple absence of data as there is data in there.
******
editor’s note: listening…..it’s all about the plasma. [wp-svg-icons icon=”heart-2″ wrap=”i”] interesting the blue sun is mentioned and is sending out energy ~ what lisa harrison mentions at the end of her latest video.
******
Published on Jul 16, 2018
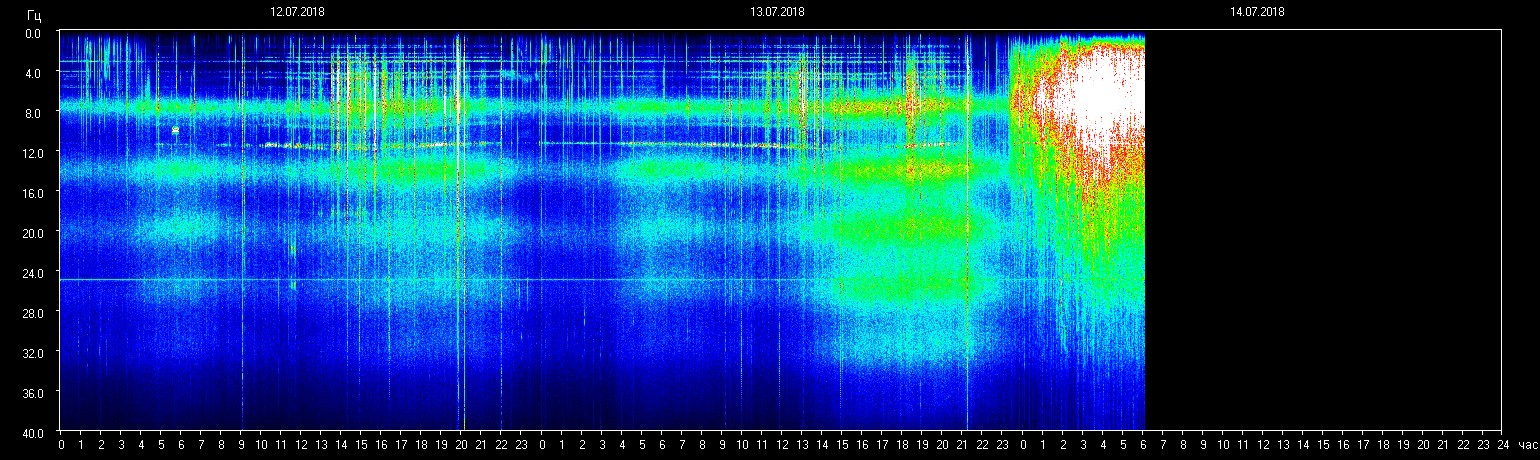
editor’s note: i have yet to hear of someone explain why the pressure line just “breaks” off like that. i have seen that twice in the last week. or weeks. my sense of “time” is uh yeah, completely gone now. lol they continue to change the numbers on the colored graph as well. i am sensing this is a representation of the merging of what was once separated ~ if not the weakening of the veil between the pit and the “real world”. and incoming UVC maybe? also lisa harrison speaking of 3ZB ~ the molecule that is present again here. maybe all is showing up on this below….
******
i thought this was quite beautiful….(nasa keeps changing the scale, btw – numerically. no surprise there. lol)

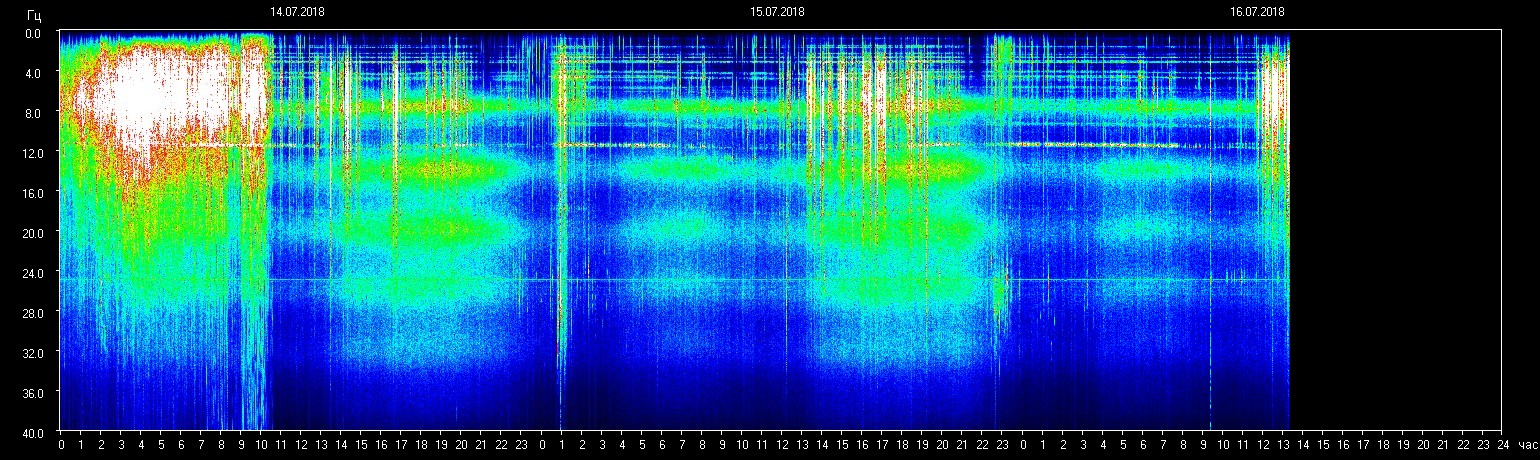
editor’s note: ok i don’t know if this is a glitch but i am left to ponder what that white line on the center top is. looks like something is broken off or bending at an odd angle…normal? i don’t know…anyway – massive purple incoming as of this read…
******
interesting grid-like pattern continues….rising at this moment to about 12 hz…
******
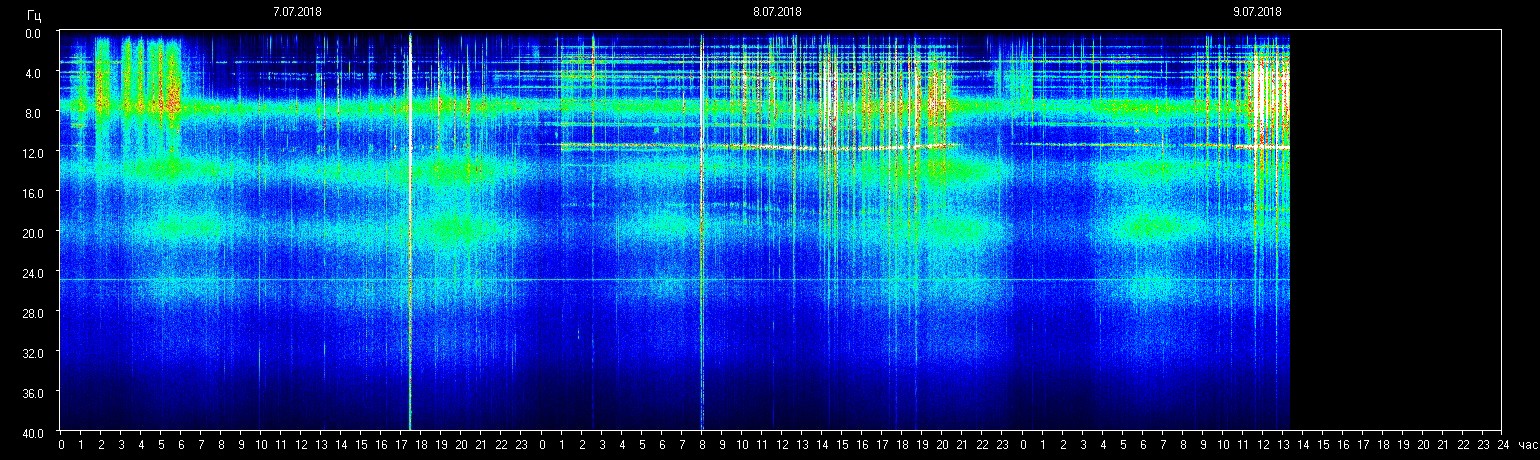
editor’s note: i would like to learn to interpret these different color bands. there is a chart ~ just need to figure out what it means. anyone else up for the challenge?
******
Sourced from here.